
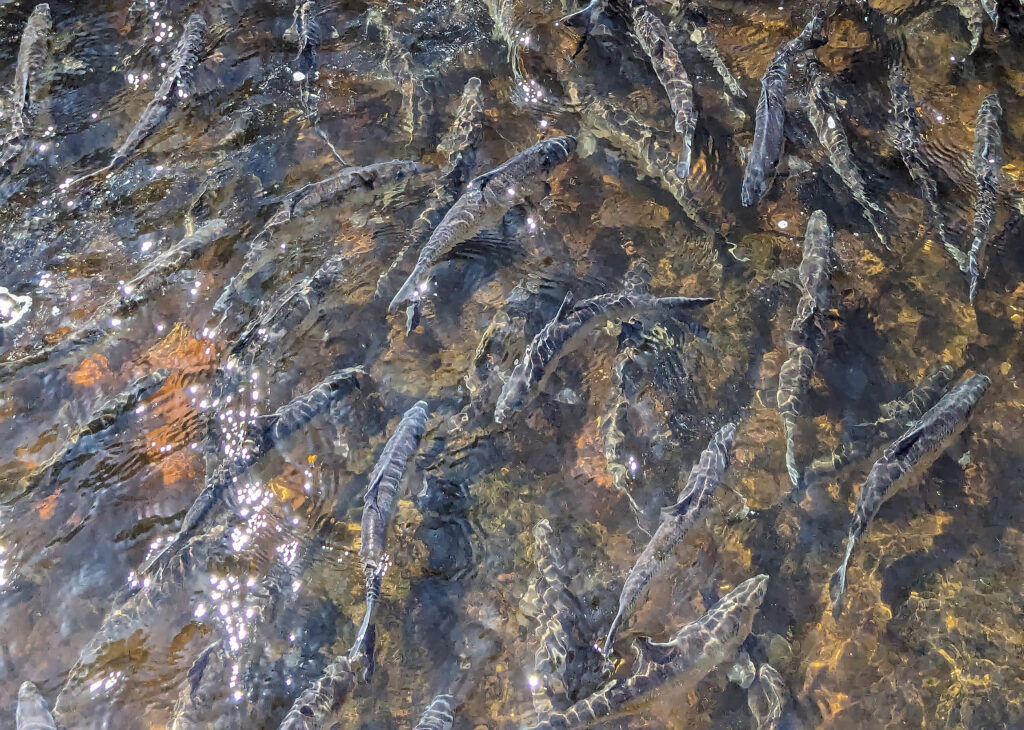
 With the changing of the seasons, the beloved river herring once again made their successful annual upstream journey. From March 30th to June 9th, over 90 of our passionate volunteers spent more than 160 hours watching and waiting for the herring to make their way to their spring spawning locations. Remarkably, this year’s count yielded the highest number of fish passing our monitoring sites of the past fifteen years, a total raw count of 15,851!
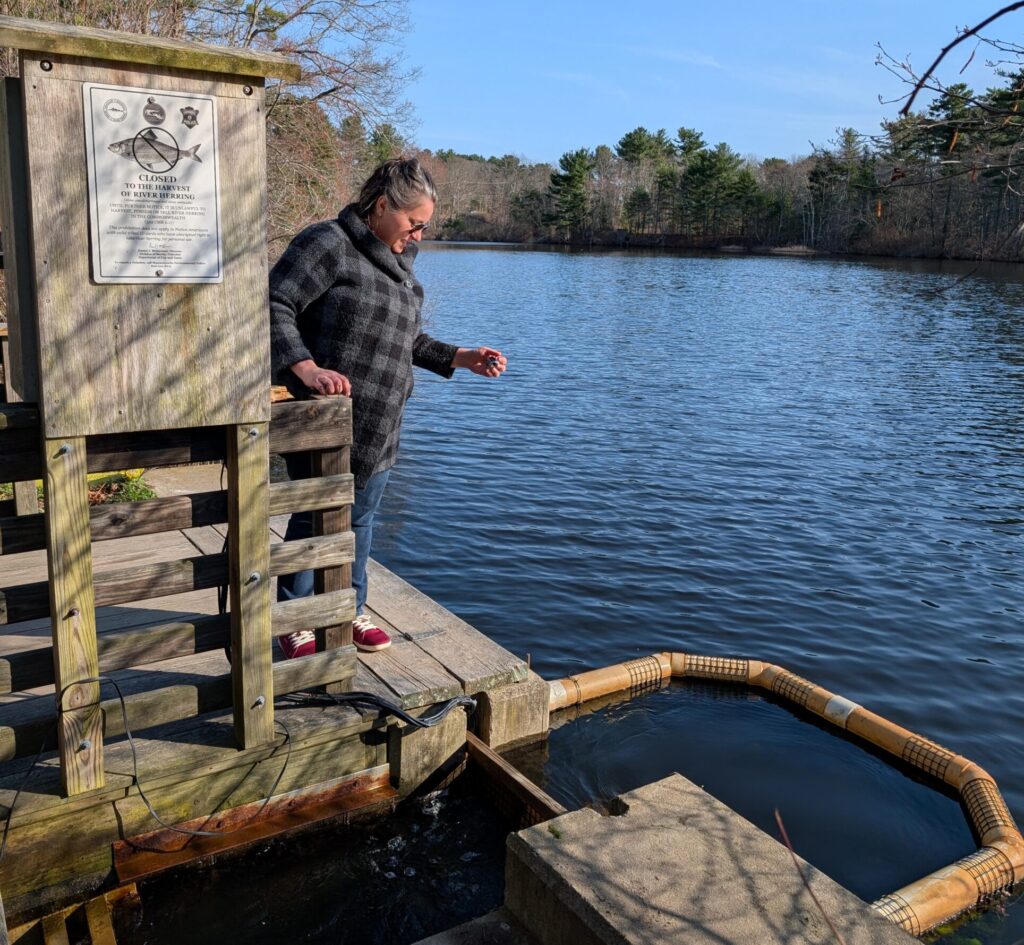
All this work could not have been done without the dedication and enthusiasm of our volunteers. Every season, they have been key to our ability to detect change in river herring populations, and the data they collect support population estimates that can give scientists and ecosystem managers alike a better clue into protecting these fish. We would like to extend a huge thank you to our volunteers for your part in making an impact!
2025 RIVER HERRING RAW DATA COUNTS AND POPULATION ESTIMATES
During the herring run each year, a raw count and a population estimate are both used to give an overall perspective on the river herring traveling through our local waters. The raw counts are the number of individual fish that are directly counted and recorded by volunteers. This means that the raw count depends on both the number of fish and the amount of time spent counting the fish, and therefore should not be taken at face value. Once volunteers complete the raw count, the numbers are sent to the Division of Marine Fisheries (MA DMF), which then assembles the data in an algorithm that estimates population size. It should also be noted that counts of “zero” do not necessarily mean that there are no herring in the system. Oftentimes, it just means that the fish are just hiding from predators in the natural environments available to them. When dams or fish ladders are present, they block or funnel fish into enclosed spaces where they are easily visible. In natural river conditions, it can often be very hard to see the fish that are unconstrained and pass freely. In other cases, the zeroes do reflect an impairment in the habitat, such as with dam removal projects or inadequate access to spawning and nursery habitats. Because of this, “zero” counts are just as valuable as any other data point, especially in understanding longer-term trends.
| Location | Raw count 2025 | Population estimate 2025 |
| Bound Brook | 0 | 0 |
| First Herring Brook | 16 | 410 |
| South River | 257 | 5,844 |
| Third Herring Brook | 0 | 0 |
| Herring Brook | 15,578 | 200,679 |
INDIVIDUAL SITE DISCUSSION
Bound Brook – Scituate and Cohasset
Bound Brook is unique in that it is residually affected by the Hunters Pond dam, which was removed seven years ago. As with many of our dam removal projects in systems that had extirpated herring populations, we have seen them struggle to recover, as the only fish that enter the system are “scouts” exploring new streams. Still, there is confidence in more coming into the system, especially since herring that pass the Hunters Pond site have passage via two fish ladders to a large amount of habitat in the Aaron River Reservoir. With a renewed interest in reviving this herring population, we are hopeful that future efforts will eventually bring a rebound of passing herring.
First Herring Brook – Scituate
Since the restoration of the Old Oaken Bucket fish ladder in 2012, counts at First Herring Brook have remained stagnantly low. Though First Herring Brook gave the smallest count, with volunteers spotting 16 fish, it is still an increase from previous years in this location. Future expansion of the habitat through increasing access to the reservoir upstream may be able to improve conditions for herring to pass in the coming years.
South River – Marshfield
The South River has arguably the most noticeable increase in observed river herring, with a total count of 257 fish! Early this year, the Veterans Park underwent an extensive reconstruction to remove the South River’s first dam. Once the dam was successfully taken down, a temporary bypass channel was created for this project for migratory fish to continue their journey around the construction. Astonishingly, the results of this project have already become observable—the number of observed herring passing through the bypass channel amounted to over twenty-two times the amount of 2024. The remainder of the Veterans Park project will focus on creating a nature-like fishway where the dam once was, reconnecting the South River from the ocean to the freshwater, and restoring the riverine habitat.
Third Herring Brook – Norwell
The counting location was changed in 2024 to observe if fish are making it past all the dam removal sites on Third Herring Brook. Though no fish have been seen yet, we are currently taking consistent flow measurements and collaborating with MA DMF to ensure that future herring populations will be able to pass through with ease. Through the continuation of this work in 2026, we are hopeful that populations will be able to recover eventually.
Herring Brook – Pembroke
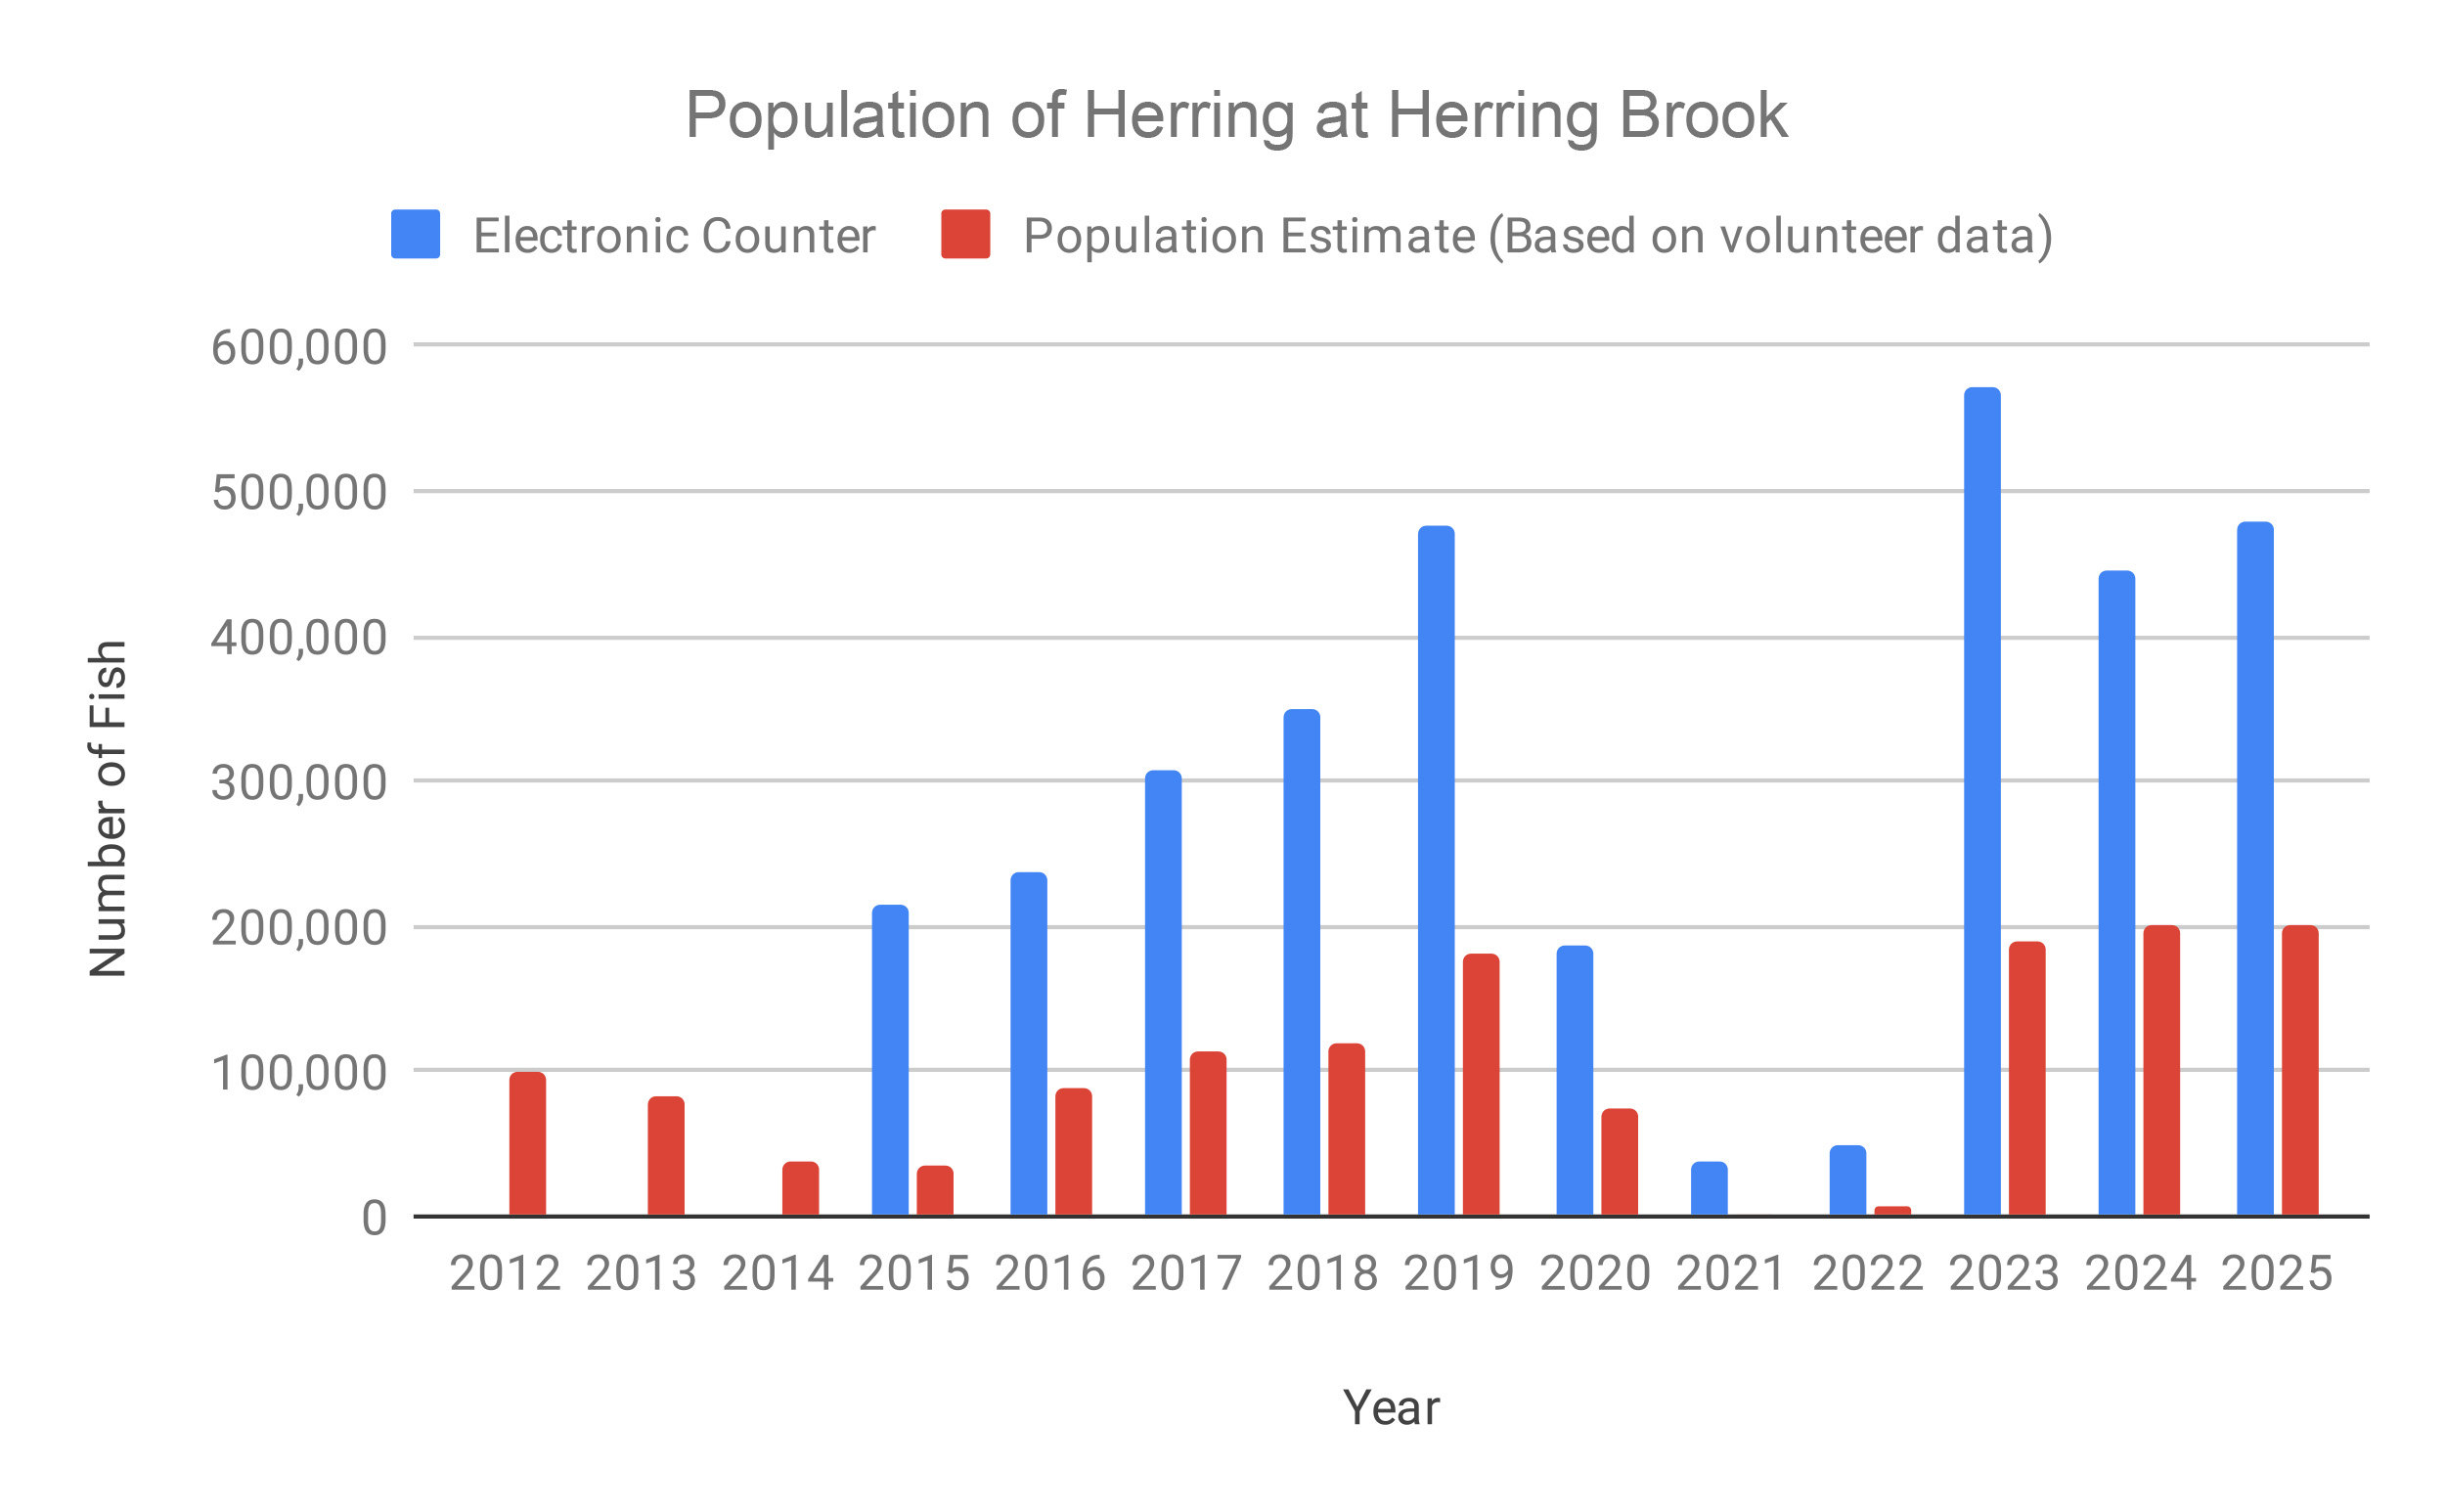
Each year, Herring Brook yields our most robust herring population, and this year was no exception! Volunteers counted a total of 15,578 herring passing through, a 42% increase since 2024 and a strong 148% increase since 2023. This continues to be one of the largest runs in the state and is an inspiring place to watch the spring migration.
Additionally, MA DMF operates an electronic counting device on Herring Brook, which is able to count every fish that passes by at all times of the day. This data is considered the “true population” and is an excellent complement to the estimates we get from our volunteer counts.
Overall, this year was incredibly successful both in turnout of herring and volunteers, and we are looking forward to continuing this momentum in the coming years. Thank you again to all who participated – we hope you will join us in 2026!