
 By Patrick Scott, Water Quality Intern
Located in the inland towns of Rockland and Hanover are the headwaters to the North River, tributaries that act as sources of water for the downstream rivers. These headwaters include streams like French’s Stream, Longwater Brook, Cushing Brook, Ben Mann Brook, Indian Head Brook, and the Drinkwater and Indian Head Rivers. In previous sampling we had noticed that there was higher concentrations of bacteria stemming from this area of the watershed.
The goal of this project is to determine where along these streams excess bacteria is coming from. Funded through a grant by the Massachusetts Department of Environmental Protection (MassDEP), bacterial source tracking is an iterative sampling method we are using to hone in on areas that could be the source of bacterial contamination. The data provided in this report includes samples taken through August 31st. We are hoping to take more wet weather samples in September (if it rains).
An important note is that wet samples provide greater concentrations of E. coli as runoff is increased during rain events, meaning that more bacteria is flushed into rivers and streams. In fact, the highest values ever reached this summer were found from the sampling that took place on August 15th, which occurred during a heavy rain event.
Table 1. The figure below illustrates the cfu (colony formula units) per 100mL values for each site recorded during a specified sampling day and the saturation of the samples.

So far, there have been 16 rounds of sampling, 12 dry samples and 4 wet, with higher concentrations being recorded in wet events. However, the colony forming units or cfu values of the most recent round of sampling were near or higher than the values found in the first round of sampling. This change is likely due to an increase in temperature over the course of the summer and consistent rainfall occurring. The average water temperature in the sampling sites has increased by 5.0˚C and there has been, on average, more than one rainfall event per week.
Originally, 15 sites were sampled, but have since been decreased to 13 sites, with the inclusion of some new sites. Typically, there are multiple sources of pollution for a given stream, so narrowing down testing sites helps to identify where excess bacteria may be coming from. Concentrations downstream have typically been much lower, potentially due to fewer sources of pollution in those areas.
Figure 1. Concentrations of E. coli over time for each site.

During the course of the summer the density of E. coli at each site has fluctuated. However, the most recent sampling period has shown a more diverse range of values than the initial samples taken on May 25th. Some sites have seen a general decline in concentrations such as FR1, but most have not had major changes occur. Spikes are likely due to high concentrations being observed during wet weather events and then stabilizing during dry conditions.
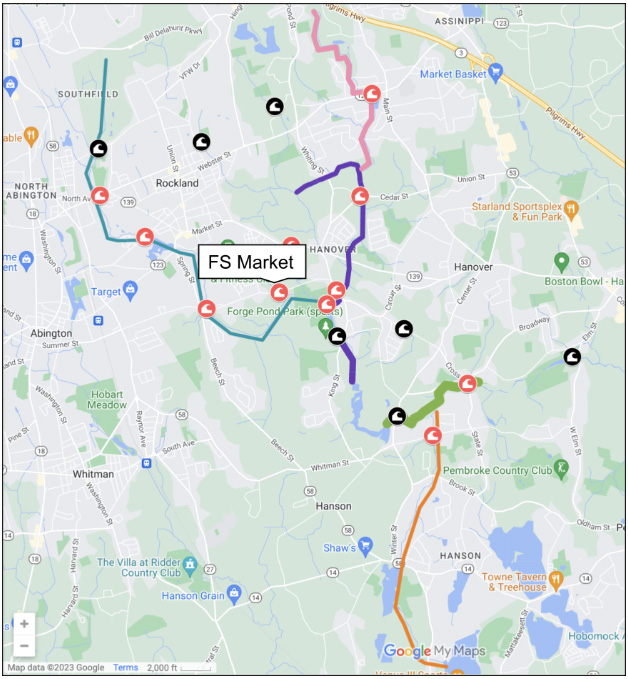
Figure 2. Map of the headwater sampling sites. Current sites being sampled are represented with a red pin, while previous sites that are no longer being sampled are black. Each river, stream, or brook has been traced with a colored line, turquoise for French Stream, pink for Longwater Brook, purple for Drinkwater River, green for Indian Head River, and orange for Indian Head Brook.
French Stream and Drinkwater River have consistently had the highest concentrations of E. coli. Site “FS Market ” had the highest concentration recorded this summer at 12,997 cfu on August 15th, shown in Table 1.
Another note is that sites further downstream from Forge Pond Park have generally had low enough concentrations to be removed as a sampling site. A possible explanation is that samples collected from these locations are more diluted or the bacteria settle out as the river enters the impoundment. More examination must be taken in this area.
Figure 3. The images below show an enhanced version of French Stream near Summer Street Conservation Land (left) and the beginning of Drinkwater River (right). Red symbols indicate higher bacterial counts, while black symbol means the area is lower in bacterial concentration.
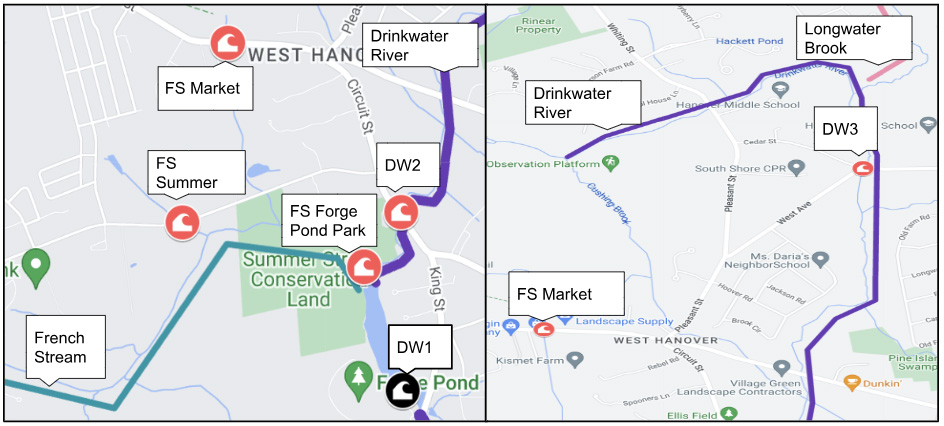
Another reason for the high concentrations in these streams is that there are multiple other sources of water that lead into them. The left-hand side of Figure 3 shows two streams feeding into French Stream. The two sites sampled here are FS Summer and FS Market. Each of these streams have had high concentrations, and explain why French Stream and site FS Forge Pond Park has had such high concentrations.
The right side of Figure 3 shows the beginning of Drinkwater River and the stream that leads into it. Cushing Brook was originally one of the streams being sampled, however, after continuously low concentrations of E. coli were recorded it has been omitted. Even with low concentrations Cushing Brook is still providing excess bacteria into Drinkwater River, increasing its overall E. coli concentrations.
The general trend of E. coli concentrations has been an increase as the sites move further downstream, until after they’ve traveled through multiple ponds. Concentrations have overall increased during the course of the summer and have diversified in value as well. While there is no one source of pollution for local waters, consistent rainfall and increasing temperatures do cause higher concentrations of bacteria. There are also many streams with cumulative sources such as French Stream and Drinkwater River. This explains why sites like FS Forge Pond Park which should have lower concentrations as they are located further downstream have reached some of the highest concentrations recorded.
The data to date enables us to hone in on the watersheds to French Stream, Longwater Brook, and Drinkwater River for further investigation. That investigation includes more bacterial sampling along with mapping of the land uses and stormdrain systems in these watersheds to identify what the potential sources are and how we can work with the owners of land and stormdrain systems to reduce their bacterial loading.