
The RiverWatch Water Quality surveys determine whether or not sites along the North and South Rivers have exceeded bacterial colony concentration numbers per Massachusetts swimming (enterococcus) and shellfishing (fecal coliform) standards. Enterococcus colonies were collected at all ten sites along the North and South Rivers to determine swimming standards, while fecal coliform samples were collected in shellfish growing areas (none of which are open at the moment for harvest). According to Massachusetts swimming standards, enterococcus levels may not exceed 104 cfu per 100mL of water sampled. The Mass. Division of Marine Fisheries shellfishing standard is 14 cfu per 100mL of fecal coliform.
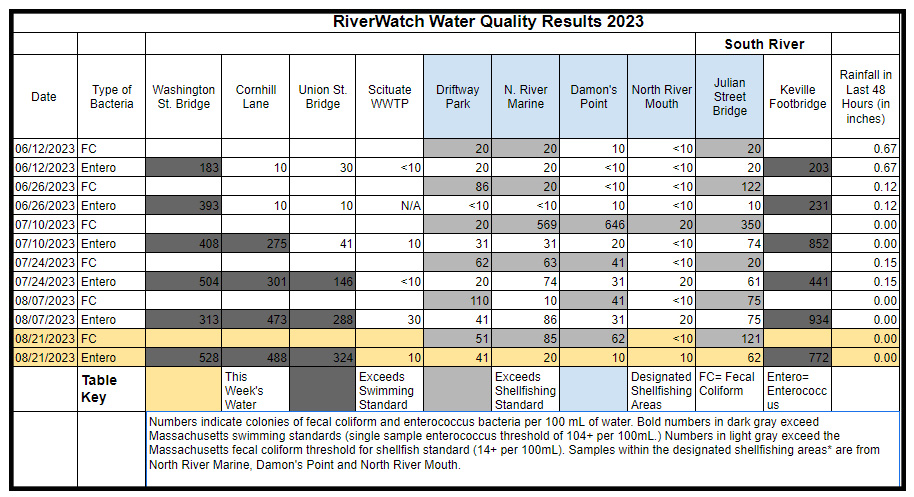
For the samples taken on Monday, August 21th, samples at Washington St. Bridge, Corn Hill Lane, Union St. Bridge, and Keville Footbridge all exceeded the Massachusetts swimming standard for enterococcus. Samples at Washington St. Bridge and Keville Footbridge have shown consistently high concentration of enterococcus in the past six rounds of sampling while Corn Hill Lane and Union St. have joined in being consistently above the swimming standards for the last 4 and 3 rounds of sampling respectively. This week did not show any drastic changes in cfu values, as most sites stayed at similar levels as previously sampled.
Shellfish beds are closed from May 31 until November 1 so the information presented in this section is purely for informational purposes. Concentrations of fecal coliform exceeded the shellfish standards at all shellfishing areas with the exception of the mouth of the rivers.
In this round of sampling both enterococcus and fecal coliform concentrations were consistently high at the same sites, one new site, and some sites have increased compared to the August 7th round of sampling. While there was no rainfall recorded within 48 hours of sampling on August 21st, more recent rainfall in the area may be a cause for higher concentrations at some sites. This summer has shown consistent and widespread bacterial exceedances throughout the rivers for the bacterial swimming standards. We attribute this to the large amounts of rainfall we have experienced this summer (July was the fourth wettest on record for the state!) which brings more bacteria into the rivers from stormwater runoff.
This week’s RiverWatch Sampling is the last round for this summer. We would never have been able to gather this crucial data about our watershed without the help of our amazing volunteers. Thank you to all who volunteered with this project, your help has been invaluable!
By analyzing the data these volunteers helped us gather, we found that roughly 32% of our samples exceeded the swimming standards and about 73% exceeded standards for shellfishing this year. Compared against last year, when we found only an 8% and 27% exceedance rate for swimming and shellfishing respectively, this may seem like a concerning rise. However, the increase is not surprising given the large amount of rain this summer. In 2022, we experienced a very dry summer, bringing less bacteria into the watershed via runoff. This trend is further confirmed when looking at previous years. 2021, another wet summer, saw an exceedance rate for swimming and shellfishing of 23% and 83% respectively, while the much drier 2020 saw rates of only 15% and 53%. Given this data, it seems the amount of bacteria in our watershed can be correlated to the amount of rainfall during each year, but take a look at the graphs with the last four years of data and decide for yourself! Each box highlighted in gray represents a level exceeding the swimming or shellfishing standards set by the state, while the white boxes represent samples with levels below the standards.
